How to Characterize RF Distortion – Part 3: Demodulation and Troubleshooting
In previous posts, I discussed how to examine the distortion impacts through statistical analysis of the signal power levels with the CCDF curves and power analysis in the frequency domain. In this post, I’ll discuss demodulation analysis that can help you perform advanced characterization and troubleshoot your RF designs.
Digital Demodulation Analysis
An ideal transmitter outputs a digitally modulated signal which has constellation points at the ideal locations. However, various imperfections such as phase noise, system noise, distortion, and modulator impairments move the constellation points out of the ideal locations, resulting in a weak communication link.
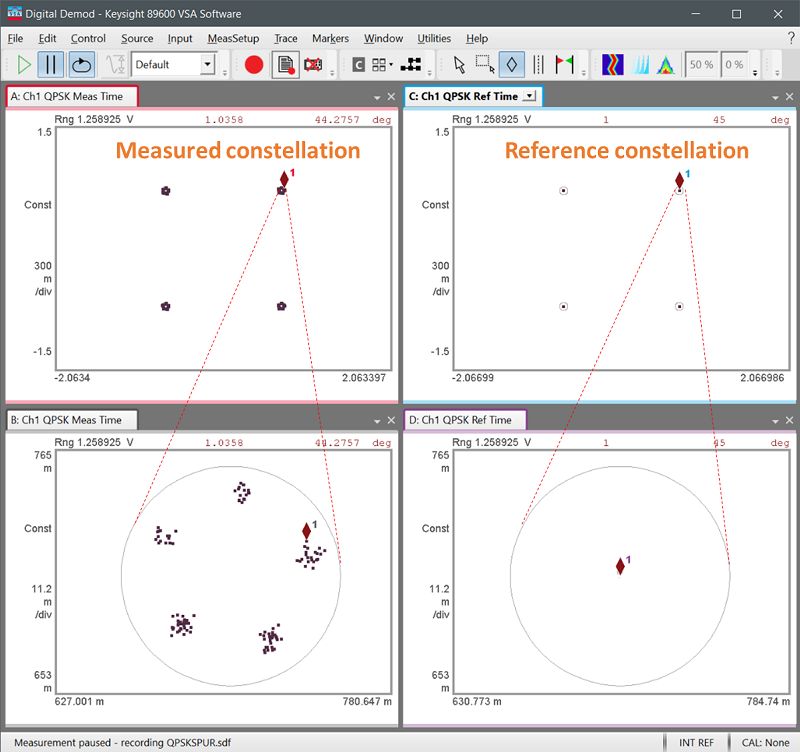
Figure 1 is a constellation diagram for a QPSK signal. On the right side of the figure is the ideal QPSK constellation (upper right) and zoom-in diagram (lower right). On the left side of the figure, the measured result appears (upper left) and zoom-in diagram (lower left). The measured zoom-in diagram shows some spreading of constellation points.

Quantify Modulated Signals
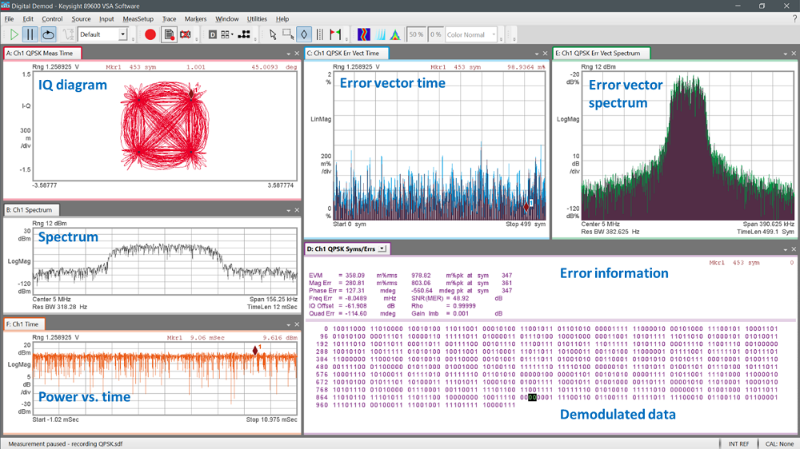
Use error vector magnitude (EVM) measurement to quantify the performance of digitally modulated signals, which is a measure of how far the constellation points from the ideal points. Figure 2 illustrates the demodulation analysis, including I/Q diagram, signal spectrum, power vs. time, error vector time, error vector spectrum, error summary, and demodulated bits. To learn about the basics of digital modulation and EVM, refer to my earlier post, “Quantify Your Digital Modulation Signals Performance.”

Troubleshoot Transmitter Designs
Successful designs require the ability to evaluate a signal and deduce the source of a problem. Through vector signal analysis, you can demodulate digitally modulated signals and examine error metrics, such as EVM, I/Q offset, phase error, and frequency error. You can further analyze and verify the root causes for the source point of the errors. Look into the sub-systems or components with a stimulus/response test to troubleshoot the designs.
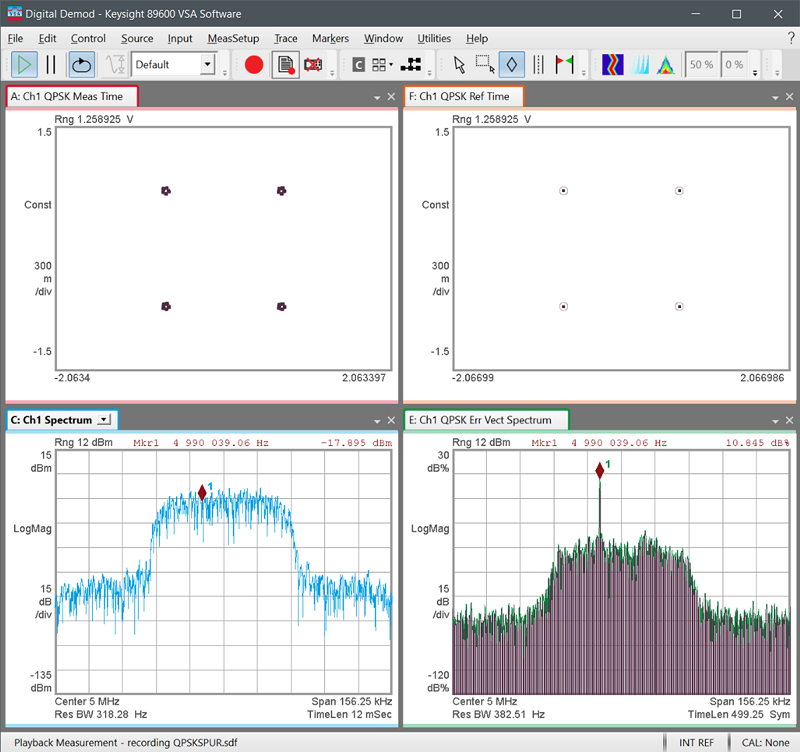
Using the same example in Figure 1, we see no distinctive clues about the source of the impairment coming from the spreading of constellation points. However, you can compute the discrete error vector trace using a fast Fourier transform (FFT) to produce the error vector spectrum as shown in Figure 3. At marker 1, there is a strange place in the error vector spectrum diagram – an in-channel spurious signal. Now, return to the zoom-in constellation diagram in Figure 1. All the symbols hover around the center with a constant distance, which means all the error vectors have the same amplitude. If you observe this kind of signal behavior, you can assume that the test signal includes an unwanted spurious signal. Use error vector spectrum measurement to identify the frequency of the spurious signal.

To learn about the common impairments of a transmitter and how to troubleshoot them, download the application note, “Testing and Troubleshooting Digital RF Communications Transmitter Designs.”
3 Steps to Characterize and Troubleshoot Your Designs
To fully characterize your RF components, you need to know the power characteristic of the simulated input signal and the measured output signal. Perform stimulus-response tests, such as CCDF, harmonics, TOI, ACP, and EVM to understand the performance of the RF components under various conditions to determine the best trade-offs in your design.
- Characterize digitally modulated signals.
- Make distortion measurements.
- Demodulate and troubleshoot modulated signals.
Performing these three steps will ensure that you make solid design choices and create a great product.