Quantify Your Digital Modulation Signals Performance
In consumer wireless, military communications, or radar, you face a continual bandwidth crunch in a spectrum that is filled with interference. So, testing your devices via signal simulation is critical. With channel capacity increasing and the complexity of modulation schemes, signal generators now require wider bandwidths and higher fidelity simulations. Modulation quality is a major consideration for signal generators prior to performing your measurements. Ensure you test your Device Under Test’s (DUT) performance instead of the performance of the signal generator.
What Is Modulation and Why Do We Modulate a Signal
Modulation is the process of modifying a high-frequency signal. The high-frequency signal is often referred to as the carrier frequency since it carries the information on it. But why do we modulate signals? There are at least two reasons: to allow the simultaneous transmission of two or more baseband signals by translating them to different frequencies and to take advantage of the greater efficiency and smaller size of higher-frequency antennae.
Digital Modulation
Amplitude, frequency, and phase modulations are basic modulation methods that apply to a carrier signal. Express modulating signals in polar form (vector) as a magnitude and phase. Digital modulation is often expressed in terms of I (in-phase) and Q (quadrature) components by removing carrier frequency, a.k.a. I/Q diagram, as shown in Figure 1. \

Figure 1. I/Q diagram
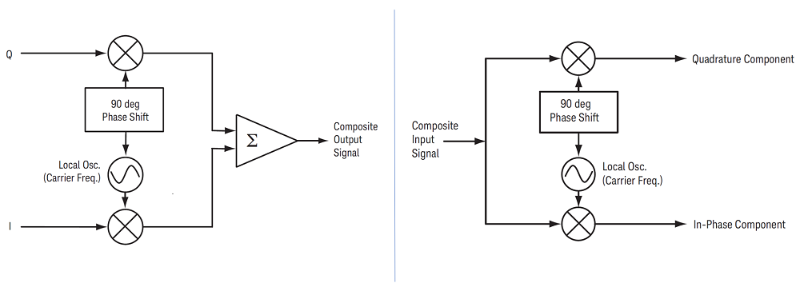
In a digital transmitter, I and Q signals mix with the same local oscillator (LO) but with a 90-degree phase shifter placed in one of the LO paths, as shown in Figure 2. This 90-degree phase shift makes the I and Q signals orthogonal to each other, and as such, they don't interfere with each other. At the receiver side, we can use the same LO and place a 90-degree phase shifter in one of the LO paths to break the composite signal into its original I and Q components.
The main advantage of I/Q modulation is the symmetric ease of combining independent signal components into a single composite signal and later splitting such a composite signal into its independent components.

Figure 2. I and Q in a digital transmitter (left) and receiver (right)
Understand Error Vector Magnitude
Error Vector Magnitude (EVM) measurements provide a simple and quantitative figure-of-merit for a digital modulation signal. The errors may result from phase noise of local oscillators, noise from power amplifiers, I/Q modulator impairments, and many other sources. EVM is a major indicator that evaluates the modulation quality of vector signal generators. For example, a high-performance signal generator can provide EVM as low as 0.4% for a 160 MHz 802.11ac signal. Low EVM performance provides more test margin for receiver sensitivity and component characteristics tests.
Definition of EVM
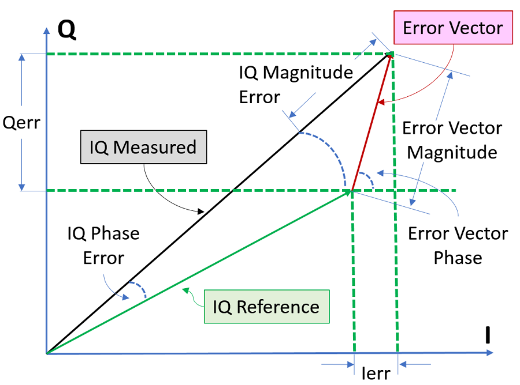
EVM is the Root Mean Square (RMS) of the error vectors computed and expressed as a percentage of the EVM Normalization Reference. The error vector (red arrow) originates from the detected point of the I/Q reference signal vector (green arrow) to the I/Q measured-signal vector (black arrow) which appears in Figure 7. The error vector magnitude is the length of the error vector. The following equation is the calculation of the EVM metric:

Where n = symbol index
N = number of symbols
Ierr = I Ref – I Meas
Qerr = Q ref – Q Meas

Figure 7. Error vector graphic
Calculate EVM from the symbol points only. In addition, some wireless standards use “dB” for EVM results, such as Wi-Fi and LTE. The conversion equation appears below. For example, 1% EVM is equal to -40 dB EVM.
EVM (dB) = 20 log10 (EVM (%))
EVM performance of signal generators has a big impact on both transmitter and receiver tests. The EVM performance is typically 5 to 10 dB lower than a device’s performance or test specification. For example, the 802.11ax transmitter EVM specification requirement for 1024 QAM is -35 dB. Chipset R&D engineers prefer residual EVM floor of signal generators lower than -45 dB. For production test, EVM performance should be less than -40 dB as a 5-dB test margin.
Generate True Performance
Signal generators provide precise, highly stable test signals for a variety of components and system test applications. To know your device’s characteristics, you need to simulate clean or dirty test signals to test your design. Modulation quality of signal generators is an important specification to evaluate your DUT’s performance. Establishing flexibility to inject impairments into the test signals can provide additional insights on your DUT’s true performance.
To learn more about digital modulation, download the latest white paper.