
Take Charge of Your EVM Measurements
A closer look at the 802.11be standard and EVM measurement
Wireless technologies increase signal bandwidth and use higher-order modulation schemes to achieve faster data rates. However, meeting regulatory standards is becoming a challenge if you fail to prepare correctly.
While in the early development stages, the next generation 802.11 standard, 802.11be Wi-Fi 7, holds great promise. A host of new features will significantly increase throughput and support real-time applications. These features include 320 MHz transmission bandwidth, 4096-QAM modulation, and enhancements to multiple-input multiple-output (MIMO) with additional spatial streams. Like 802.11ax, 802.11be will also operate in 2.4, 5, and 6 GHz frequency bands. To achieve greater data capacity, it’s clear that you need to meet the stringent error vector magnitude (EVM) requirements of denser modulation schemes.
EVM measurement 101
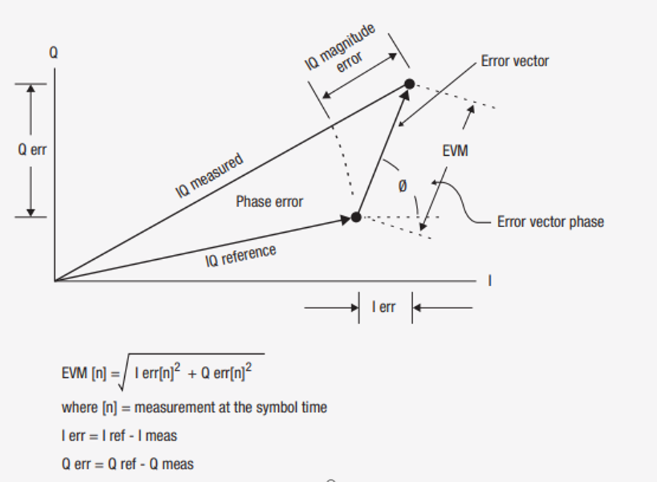
The error vector is the difference between the ideal reference signal and the measured signal at a given time. Expressed another way, it is the residual noise and distortion remaining after an ideal version of the signal falls away. Depending on the technology, you will report EVM as a percentage of the square root of the mean power of the ideal signal, as a percentage of the square root of the average symbol power, or as a percentage of the peak signal level, typically defined by the constellation’s corner states.
You can also report the EVM value in dB units, and some wireless networking standards use the term relative constellation error (RCE) instead of EVM. While the error vector has a phase value associated with it, this angle generally turns out to be random because it is a function of both the error itself and the position of the data symbol on the constellation, which, for all practical purposes, is random. You can measure a more useful angle between the actual and ideal phasors, which contains valuable information in troubleshooting signal problems. Likewise, IQ error magnitude, or magnitude error, shows the magnitude difference between the actual and ideal signals.\
The role of EVM in the next generation IEEE 802.11be
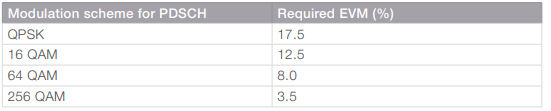
EVM measurements offer powerful insight into the performance of communication transmitters and receivers. The measurements indicate waveform distortion, representing a device’s phase, amplitude, and noise characteristics. Moreover, the Institute of Electrical and Electronics Engineers (IEEE) defines the maximum permitted transmitter constellation error as part of the standard. The maximum allowed depends on the data rate, or constellation size, since higher-order constellation requires a tighter modulation accuracy. \
However, EVM measurement results are sensitive to any signal impairment affecting the magnitude and phase of a signal, such as IQ imbalance or device nonlinearity at baseband, intermediate frequency, or RF. EVM has become the go-to measurement.
Factors that can impact EVM measurements
As an error metric, EVM is closely related to all error sources within a system. We can quantify the EVM impact of all the impairments by calculating how they distort the received and transmitted signals. With new standards come new challenges; the following conditions represent possible causes of errors:
- increased bandwidths generate more noise and lower signal-to-noise ratio (SNR)
- phase noise of local oscillators (LOs)
- complex modulations requirements that cause IQ modulator impairments
- noise from power amplifiers
Since the EVM of the device under test (DUT) is close to the EVM of the system, making the measurement, EVM measurements become more and more challenging. The most significant impact mostly comes from broadband noise generated by wideband receivers and the fact that SNR degrades as bandwidths increase. To measure device performance under these conditions, the test system’s residual EVM noise floor must be low enough to measure the DUT’s true performance. The test system’s residual EVM performance should not be the dominant source of error, or it will mask the device’s true performance.
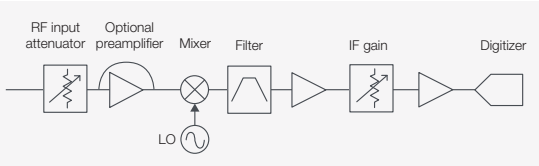
For example, the 802.11ax transmitter EVM specification requirement for 1024QAM is -35 dB. Chipset research and development engineers prefer a residual EVM floor for signal analyzers lower than -45 dB. For production testing, EVM performance should be less than -40 dB as a 5 dB test margin. The phase noise of the signal analyzer’s LO signal is translated into the input of the signal analyzer’s mixer. The direct effect of phase noise on the IQ constellation diagram is the radial smearing of the symbols. For a higher order modulation scheme such as 256QAM, the symbols are closer, and the requirement for EVM performance is higher. Ensuring that the signal analyzer’s phase noise performance will not impact the EVM measurement results is critical as it significantly contributes to EVM measurements’ errors.\
Phase noise is also the dominant cause of EVM issues in orthogonal frequency division multiplexing (OFDM) systems. OFDM is a common modulation scheme for wideband digital communication. It uses many closely spaced orthogonal subcarrier signals, each with its own modulation scheme, to transmit data in parallel. During frequency conversion with a poor phase noise LO, the subcarrier with phase noise spreads into other subcarriers as interference.
OFDM has a high peak-to-average power ratio (PAPR) causing large fluctuations in the signal envelopes. The high PAPR of OFDM means that amplifiers will operate near saturation, given the same channel power, and cause clipping signal peaks resulting in degraded EVM. Beyond that, the inherent nonlinearity of power amplifiers generates spectral regrowth, leading to adjacent channel interference and violations of out-of-band emissions standards regulatory bodies mandate. It can also cause in-band distortion, which degrades EVM.
Knowing the capabilities and performance of your signal analyzers is the first step toward making accurate and repeatable measurements. Understanding the capabilities will enable you to achieve the best EVM measurement results and align with standards.
EVM measurement use case for 802.11be
Now that you understand more about EVM and its importance to the new standards let’s take a closer look at how to optimize your EVM measurements, test the true performance of your wireless local area network (WLAN) transmitter, and ensure it meets the next-generation IEEE standards.
Keysight’s N9042B UXA X-Series signal analyzer and frequency extender deliver up to 11 GHz analysis bandwidth with the industry’s widest dynamic range and best residual EVM. Its ready-to-use measurement applications and vector signal analysis software help engineers ensure their designs meet the latest standards.
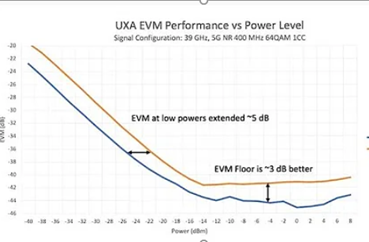
The N9042B signal analyzer delivers outstanding noise performance using a highly customized signal path frontend. It provides the best swept displayed average noise level (DANL) in the industry, down to -174 dBm at 1 GHz, and a superior dynamic range for the most precise measurements of small signals near noise in the presence of large signals. For a wide frequency range up to 110 GHz, the N9042B improves the EVM performance by 50% over a wide power range, compared to other signal analysis solutions in the market. \
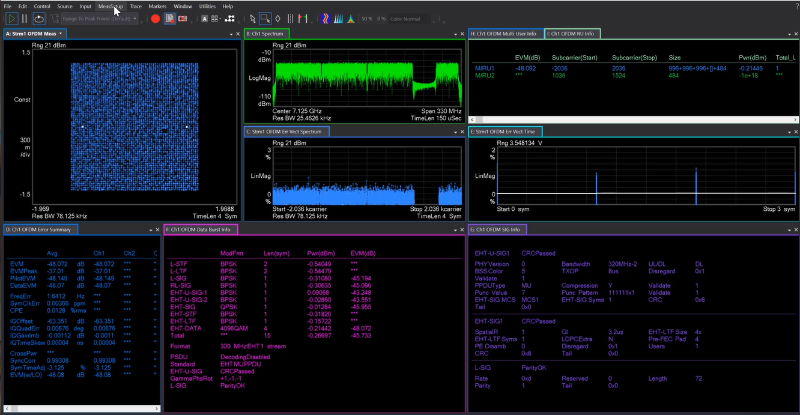
PathWave vector signal analysis (VSA) software is the heart of the signal analyzer for meeting regulatory standards. The 89600 VSA software is a comprehensive toolset for demodulation and VSA that supports more than 75 signal standards and modulation types. The VSA software enables engineers to explore nearly every facet of a signal and optimize their most advanced designs while spending less time on measurement setup and delivering repeatable results. It also provides spectrum, time and modulation quality measurements for WLAN 802.11n/ac/ax/be with option 89601BHXC and for WLAN 802.11a/b/g/j signals with option 89601B7RC. The WLAN options provide an advanced troubleshooting and evaluation toolset designed specifically to handle the analysis of legacy and new WLAN signals. For example, the WLAN options cover technologies such as multi-user (MU)-MIMO and OFDMA that you will need to comply with the latest standards.
Conclusion
Using superior phase noise performance signal analyzers is critical to see your device’s true behavior. This will help ensure that your devices meet the latest standards and regulations. In addition, take the time to conduct advanced troubleshooting and evaluate toolset specifically designed to handle the challenge of analyzing legacy and new WLAN signals. Don’t let excess noise hamper your EVM measurements.
Learn more at: WLAN 802.11x EVM Measurements.