
Signal Analysis in 5G NR Base Station Transmitters: Part 2
The evolution of standards requires signal analysis (spectrum analysis) test solutions with the help of high frequency signal analyzers to support higher frequencies, wider bandwidths, and new physical layer functionality. For successful and accurate signal analysis (spectrum analysis) testing, understanding the standards and how they impact testing is crucial when planning the next steps for 5G NR design and innovation.
In the first part of this blog series, we discussed the signal analysis (spectrum analysis) transmit power tests and requirements according to 5G NR base station transmitter testing requirements. In this blog, we will discuss the transmit signal quality in 5G NR base stations from the perspective of signal analysis (spectrum analysis), according to 3GPP standards.
Transmit Signal Quality
Transmit signal quality is an important signal analysis (spectrum analysis) metric to show the quality of the transmitted signal. It includes three measurements using signal analyzers (spectrum analyzers): frequency error, modulation quality known as error vector magnitude (EVM), and timing alignment error (TAE) for multiple input, multiple output (MIMO) or carrier aggregation cases.
Frequency Error Measurements
Frequency error measurement using a RF spectrum analyzer determines how far off a base station's actual frequency is from the frequency assigned. The purpose of this test is to ensure that the frequency error is within the requirements specified in the standard. The modulation quality is the difference between a measured carrier signal and an ideal signal. When working with high frequency and wide bandwidth signal analysis (spectrum analysis) applications, you need a high frequency spectrum analyzer that can meet the testing challenges that these applications raise.
Error Vector Magnitude Measurements
The error vector magnitude measurement using a RF spectrum analyzer is the difference between the ideal and the measured symbols (Figure 1) after equalization, and can be measured by a signal analyzer (spectrum analyzer). According to the conformance test requirements, the error vector magnitude required for the signal analysis (spectrum analysis) is the root mean square (RMS) result averaging over all the allocated subcarriers and all orthogonal frequency division multiplexing (OFDM) symbols. The purpose of this test is to verify that modulation quality falls within the minimum requirements for signal analysis (spectrum analysis). A high frequency spectrum analyzer can help you overcome specific signal analysis (spectrum analysis) testing challenges if you are dealing with high frequencies and wide bandwidth applications.
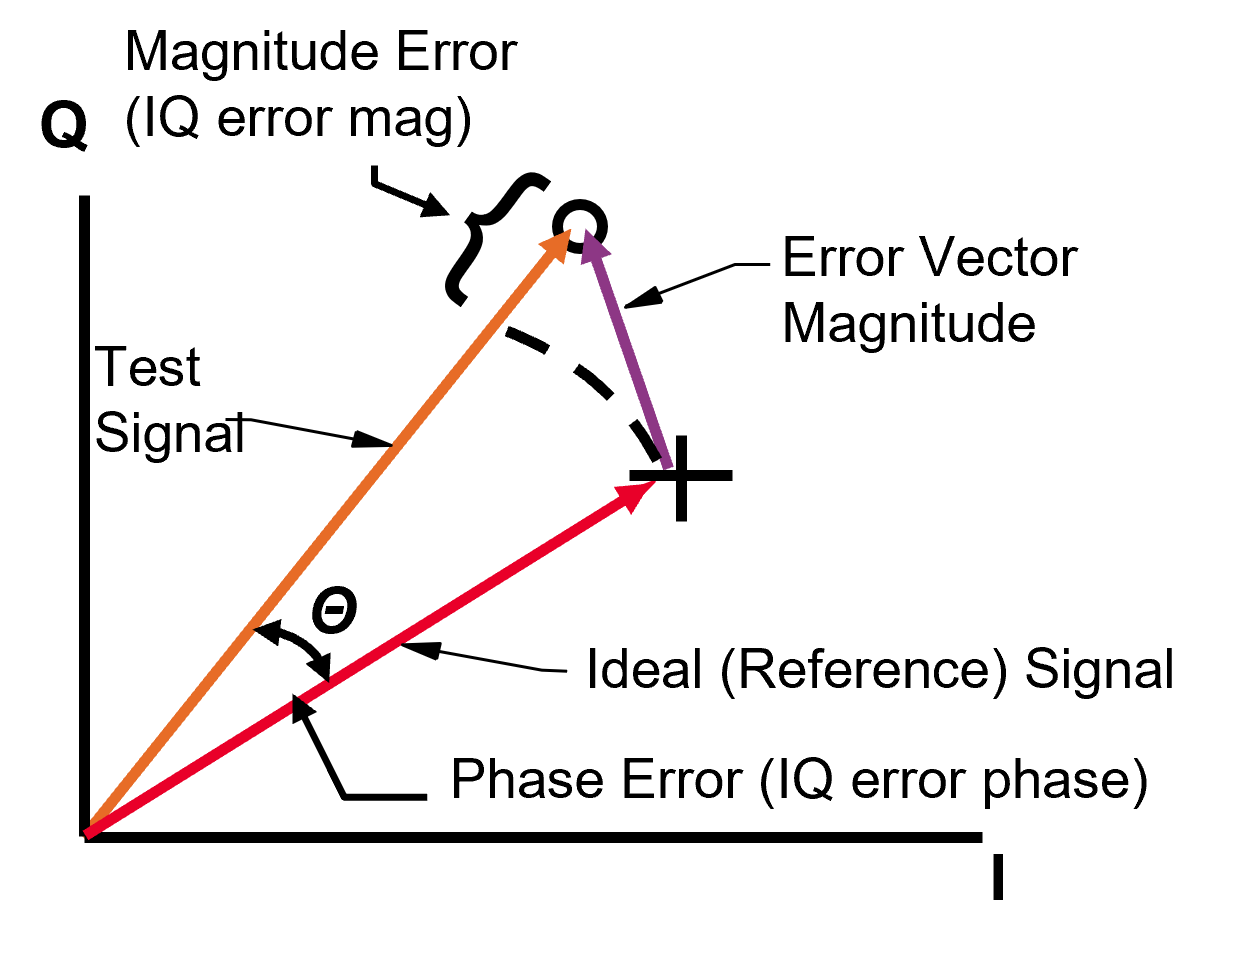
Figure 2 illustrates how the modulation analysis mode of the UXA signal analyzer (spectrum analyzer) measures the frequency error and error vector magnitude. Following synchronization and signal demodulation, various signal analysis (spectrum analysis) measurement results are displayed either as numeric tables or as traces for better visualization. Figure 2 shows an example of using TM 3.1a for 256QAM modulation instead of a complicated and time-consuming signal analyzer (spectrum analyzer) setup. The quick preset in Keysight’s UXA signal analyzers (spectrum analyzers) and PathWave X-Series measurement applications enables you to automatically configure all the demodulation settings to improve your signal analysis (spectrum analysis) test efficiency significantly.

TAE Measurements
By using a RF spectrum analyzer, TAE can be measured as the time gap between DMRS ports that should be smaller than a certain level. This signal analysis (spectrum analysis) requirement applies to frame timing in MIMO transmission, carrier aggregation, and respective combinations. The result represents the greatest timing difference between any two different NR signals. During the signal analysis (spectrum analysis) test, the TAE is verified to be within the minimum requirements specified by standards. Figure 3 shows the conducted TAE measurement result for a MIMO configuration, where the combination of DMRS ports 0 and 1 from different RF channels are together. This example reflects multiple input signals onto a single receiving antenna. The combined two-layer signal does not demodulate with only one receiving antenna because some traces do not contain any data. For 5G NR X-Series signal analyzer (spectrum analyzer) measurement applications, choosing TM1.1 with two layers enables synchronization to each DMRS port in the combined signal and measuring the timing error between them. In this example, the single input channel 1 detects that both DMRS ports 0 and 1 are at a certain level of power. Using port 0 as the reference, the timing error of port 1 to port 0 is about 24 ns. Besides measuring TAE, this signal analysis (spectrum analysis) can also measure the phase gap and power gap between different DMRS ports. For obtaining accurate signal analysis (spectrum analysis) results at higher frequency and wider bandwidth applications, a reliable high frequency spectrum analyzer would be an invaluable tool.\

In our next blog post, we will examine the sources and types of unwanted emissions as they relate to the base station transmitter signal analysis (spectrum analysis).