
How to Optimize Mixer Input Level of Signal Analyzer for better Signal Analysis
Signal analyzers use a superheterodyne receiver to downconvert an input signal for analysis in frequency, time, and modulation domain. As receivers do, maximizing a signal-to-noise (SNR) ratio in the signal chain is essential for obtaining accurate results of signal analysis. Also, you need to ensure that the input signal does not distort the signal analyzer.
However, there is no rule about the best mixer-level setting. The best mixer-level setting depends on measurement hardware, characteristics of the input signal, and specification test requirements.
Input Signal Characteristics
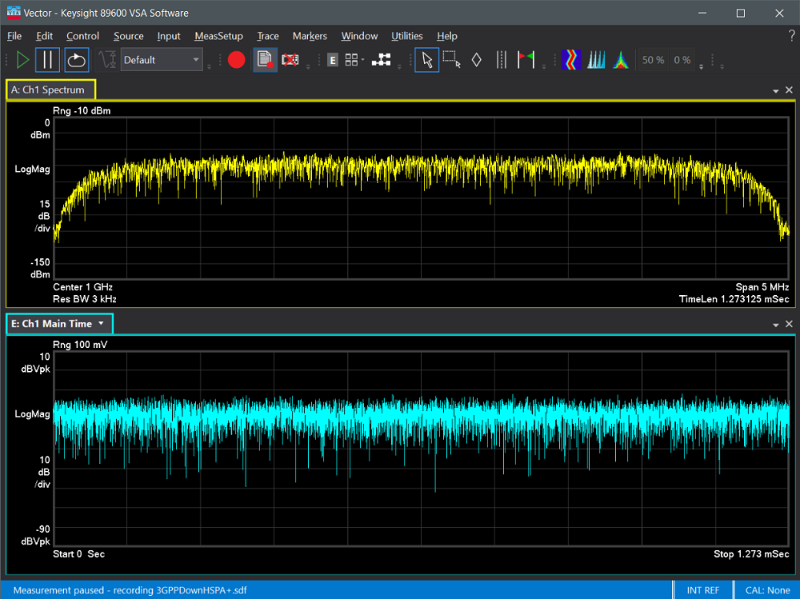
Many of the digitally modulated signals appear noise-like in the time and frequency domains. The signals are typically difficult to quantify because of their inherent randomness and inconsistency. It is critical to completely characterize and understand the power of the digital modulation in your signals. Figure 1 shows the frequency and time domains of a 3GPP HSPA downlink signal using PathWave vector signal analysis (VSA) software. The signal has a fast amplitude variation in both the time and frequency domains.
To characterize the signals, you need to extract useful power-related information. Complementary cumulative distribution function (CCDF) power curves characterize the higher-level power of a signal and provide critical information, such as the peak-to-average power ratio (PAPR). CCDF provides a statistic description of the power levels in the digitally modulated signal for evaluating nonlinearities in power amplifiers and transmitters. Figure 2 illustrates that a 5G NR signal CCDF power curve and PAPR value (10.41 dB).
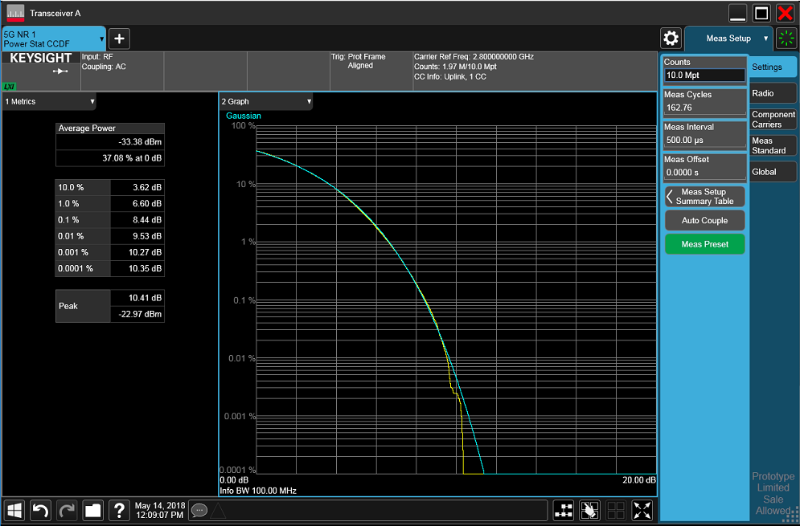
CCDF curves are an excellent tool to characterize the power distribution of digitally modulated signals. They visualize the effects of complex digital modulation formats and can help you better understand the characterization of your devices under test.
How to Optimize Mixer Input Level of a signal analyzer
Figure 3 is a simplified block diagram of a signal analyzer. When making measurements, such as ACPR and EVM, you need to set optimum levels for the signal analyzer’s input mixer to achieve the best SNR.
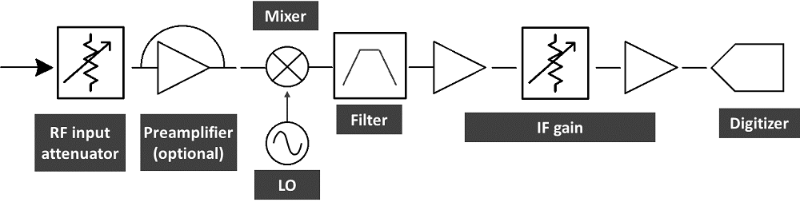
Nonlinear RF components in a signal analyzer, such as a mixer and an amplifier, may generate distortion under certain conditions. When you input a high-power signal to a signal analyzer, the signal distorts the input mixer. The distortion products include in-channel or out-of-channel unwanted spectral signals.
For modulated signals, the in-channel distortion products degrade modulation measurements, and the out-of-channel distortion products impact adjacent channel power and spurious measurements. Adjustable input attenuation prevents the input mixer distorted from high-power input signals.
Adjust input attenuation
The input attenuator of an analyzer reduces a signal passing into the input mixer. However, the input mixer-level setting is a trade-off between distortion performance and noise sensitivity. You can achieve a better SNR with a higher input mixer level or better distortion performance with a lower input mixer level. The signal analyzer offers a mechanical attenuator in a 5 dB or 2 dB step and an electronic (optional) attenuator in a 1 dB step. The finer step attenuator gives a better resolution for optimizing the input mixer level.
Enable a built-in preamplifier
In scenarios such as 5G over-the-air (OTA) tests and test systems with huge insertion loss, the input signal level can be lower than the optimum mixer level. A built-in preamplifier provides a better noise figure but a poorer intermodulation-distortion-to-noise-floor dynamic range. You can enable this setting for low-input-level test scenarios.
Adjust attenuation for minimum clipping
Keysight X-Series Signal Analyzers allow you to adjust attenuation for minimum clipping by pressing a single key to protect against input signal overloads. The signal analyzers acquire waveform with zero span setting and an appropriate resolution bandwidth (RBW), then check if the measured waveform data is clipped (IF overload) or not. If clipped, the analyzers will set higher attenuation then re-acquire waveform. Figure 4 illustrates the adjustment algorithm.
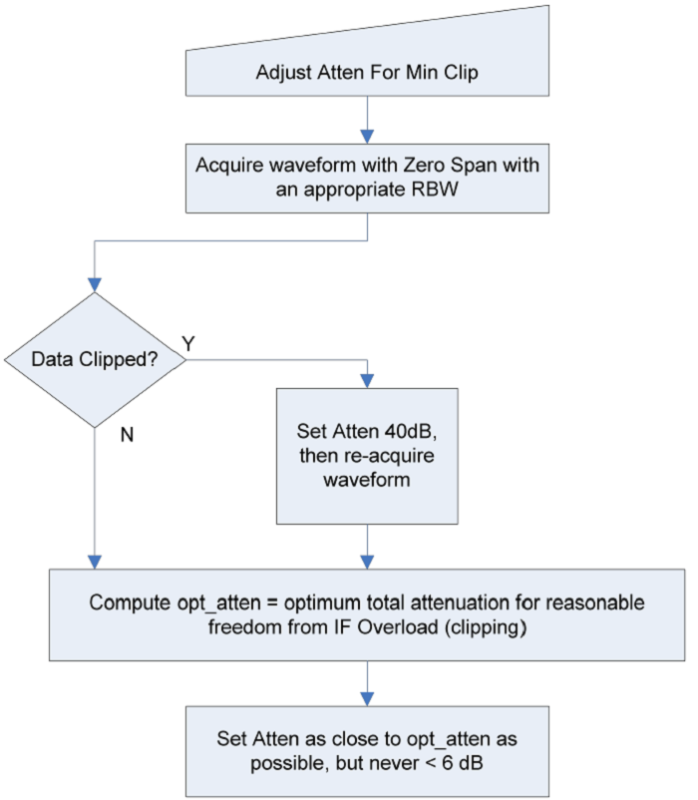
This function accelerates setting the input attenuation but does not necessarily optimize measurement dynamic range. You need to fine adjust the attenuation manually to achieve the best measurement results.
Knowing the performance of your signal analyzer and the characteristics of an input signal are the first step toward making accurate and repeatable measurements. Keysight’s signal analyzers offer flexible and optimized settings to accurately evaluate RF components and devices. In my next post, I will discuss how to optimize SNR for an IF digitizer to achieve the best demodulation analysis.
See related posts to learn about how to optimize signal demodulation analysis: