Confronting Measurement Uncertainty in Signal Generation - Part 6: Frequency Response
Previous posts in this measurement uncertainty series addressed Waveform Discontinuity, Interpolation Shoot, Waveform Sampling Issues, I/Q Impairments, and phase noise. I discussed tactics for minimizing these measurement uncertainties. In this sixth and final post in the series, I will discuss frequency responses that are caused by signal generators and extend accessories.
Frequency Response
When a signal generator outputs a modulated signal the components inside the signal generator, such as mixers, filters, and amplifiers, contribute frequency responses which degrade modulation quality. These responses occur at different frequencies and output levels, and include both amplitude and phase response.
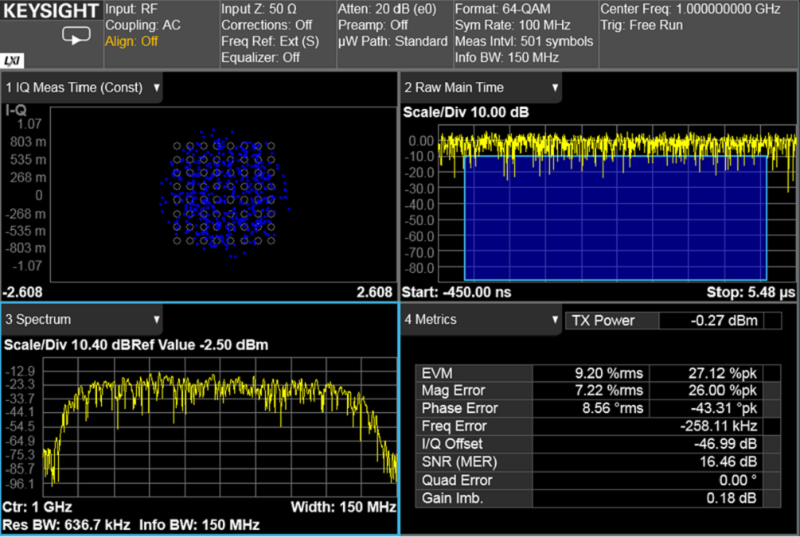
Figure 1 illustrates a 64-QAM demodulation analysis at a 100 MHz symbol rate. The I/Q constellation (upper left) is chaotic due to the wide bandwidth frequency response, and the signal cannot be demodulated correctly.

Figure 1. Frequency response impacts on signal modulation quality
With adaptive equalization enabled on the signal analyzer, you can see the signal’s amplitude (upper right), and phase response (lower right), as shown in Figure 2. The deviation of the amplitude response across the analysis bandwidth (156.3 MHz) is 0.8 dB, and the deviation of phase response is 0.3 degrees. After removing the frequency responses by applying an equalization filter, the I/Q constellation (upper left) is clear, and the error vector magnitude (EVM) is at 0.19%.
What is Adaptive Equalization?
Adaptive equalization removes linear errors from modulated signals by dynamically creating and applying a finite impulse response (FIR) compensating filter. The errors include group-delay distortion, frequency-response errors, and reflections or multipath distortion.

Figure 2. The signal’s amplitude and phase responses
Internal Channel Correction
Vector signal generators support an internal calibration routine. This routine collects correction data for both baseband and the RF magnitude and phase errors. The correction data covers the entire RF frequency ranges and goes across all power level ranges. It also includes parameters of the correction filter applied to baseband waveforms in real time.
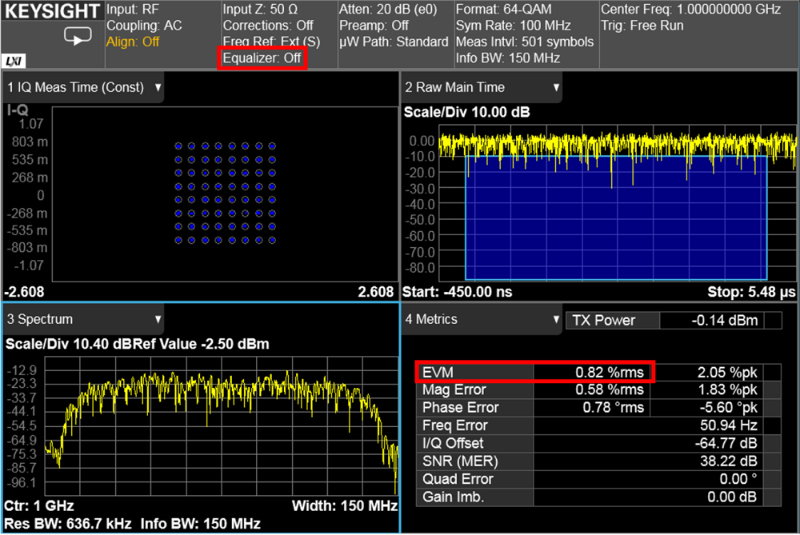
In Figure 3, you can see the demodulation analysis of the 64-QAM signal with Internal Channel Correction on. You can see that the symbols are concentrated (upper left) in the constellation diagram and EVM is 0.82%.

Figure 3. Signal generator with internal channel correction on
When the correction feature is on and you change frequency, the firmware will calculate a channel correction filter. This process requires additional time and depends on the frequency switch type.
User Channel Correction Calibration
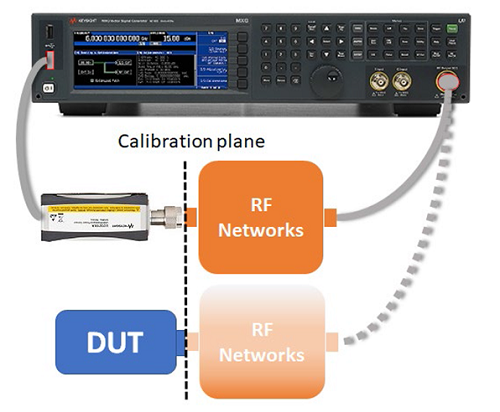
The user channel correction calibration extends the signal generator’s performance to a new calibration plane, the user's Device Under Test (DUT) input port. You can use a USB power sensor to perform the calibration as shown in Figure 4. You need to specify the start and stop frequencies, configure the power meter, and then execute the calibration.

Figure 4. Use a USB power sensor to execute user channel correction calibration
Modern signal generators provide not only wider modulation bandwidths but also ample flatness performance across the entire signal bandwidth. They achieve this combination of bandwidth and accuracy using a digital signal processing (DSP) for real-time signal processing and a factory-calibrated channel correction technique.
Generate True Performance
Minimizing your measurement uncertainty starts with knowing which signal generator capabilities, features, and performance levels you require. With the right equipment, you can generate the signals required to effectively test your DUT. Select the signal generator and measurement software that unleashes your insight, experience, and creativity while meeting your design objectives.
See related posts to learn about Confronting Measurement Uncertainty in Signal Generation: