
PathWave Manufacturing Analytics Speeds Up Root Cause Analysis
By utilizing and reviewing the data from just 3 features within PathWave Manufacturing Analytics, the Predictive Alerts, the Fixture Comparisons, and the Report Generation Tool, the root cause and corrective action process to fix a First Pass Yield issue became almost effortless. The continued use of the software later contributed to further improvements in the production lines.
A global automotive component manufacturer had a site that had tens of years of practicing continuous improvements to their manufacturing lines and striving to provide the best quality for their customers. As a high volume global automotive component manufacturer, they emphasized both quality and efficiency. So, when they had a less than perfect yield of <90%, they went all-in to find out the root cause of the issue. By using PMA, they enabled near real-time root cause analysis of the equipment fixture issues on the production floor. This process proved that PMA is able to save time by reducing this investigation from 6 months to just 5 mins.
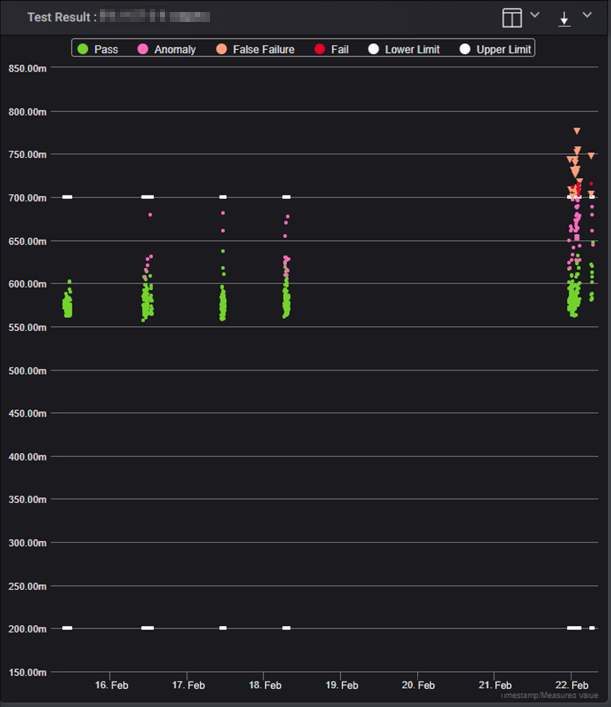
The measurement chart showing the eventual failures that affected the FPY as the volume of anomalies started to rise on 18-Feb and started to fail on 22-Feb (triangles show the retest passing boards).
The simple task of just viewing an alert and its corresponding measurement data allows investigators to eliminate the possibility of product failures in just a few clicks. This allows the user to focus on resolving their equipment or product issues rather than spending large amounts of time collecting data, analyzing, and debugging those issues.
PathWave Manufacturing Analytics helps to speed up the investigative process and reduce the downtime experienced in production by providing clear visibility to just the right amount of the test equipment’ measurement data at a glance while also allowing the user to easily capture and report it with little effort. Consequently, the production line can get back on track or even improve its capabilities with this analytics software.
For more information on how the fixture comparison and report generation tools where used, review the case study and improving First Pass Yield blog post.