
How to Make Sub-THz Measurements for 6G
6G research has begun. The next generation of cellular technology will bring new, exciting use cases by combining sensing, imaging, and precise timing with mobility. Early targets represent a 10-100X increase over 5G. The need for wider bandwidths will require the use of frequencies above 100 GHz, but sub-terahertz (sub-THz) and THz spectrum bring extreme modulation bandwidths, and even shorter wavelengths and higher propagation and atmospheric loss than millimeter-wave (mmWave) frequencies. Overcoming these challenges require flexible test solutions. Here is an overview of a testbed that addresses the bandwidth and performance demands of 6G with measurement examples.
Figure 1 shows the key components of the testbed:
- Keysight M8195A 65 GSa/s arbitrary waveform generator (AWG)
- Keysight E8267D PSG 67-GHz vector signal generator (VSG)
- Virginia Diodes Inc (VDI) up- and downconverters
- Keysight UXR oscilloscope
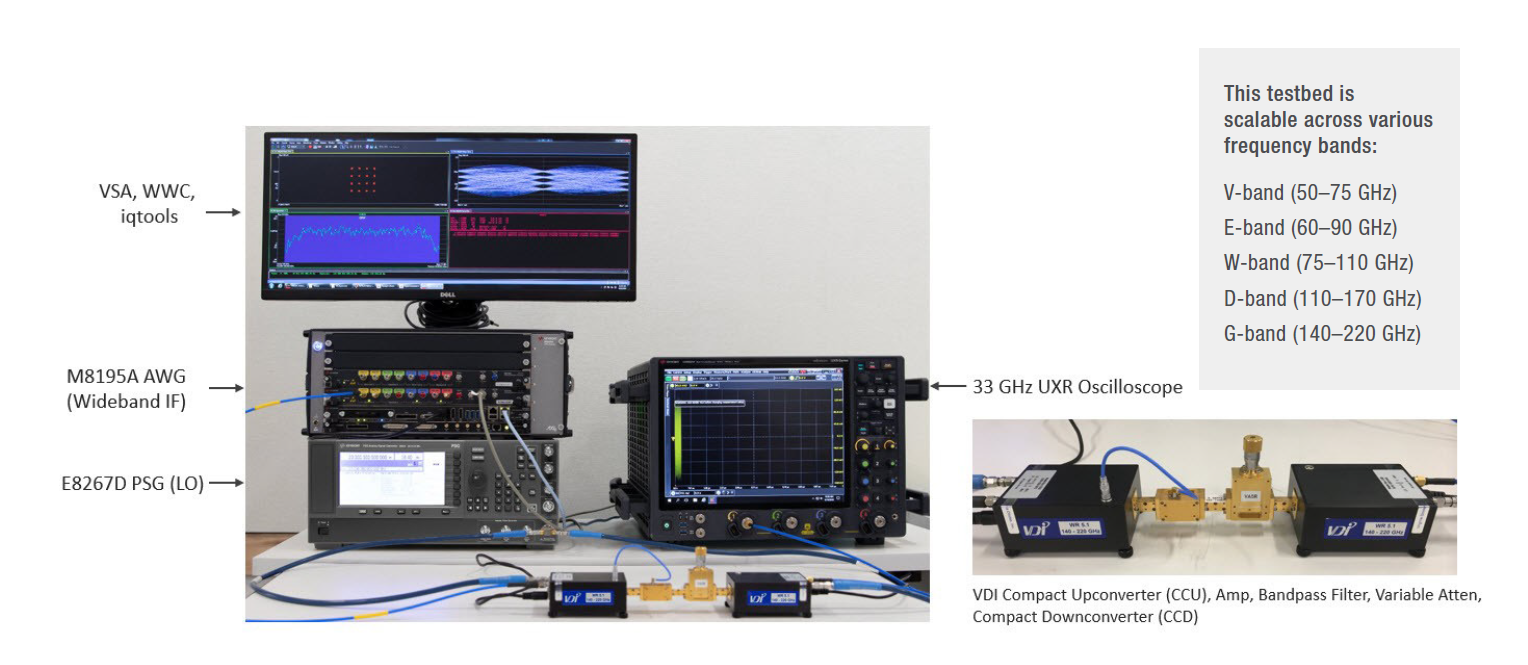
Figure 1. Sub-THz R&D testbed for wide and extreme bandwidth conducted measurements.
With an analog bandwidth of 25 GHz, the multichannel M8195A generates wideband and extreme-bandwidth modulated intermediate frequency (IF) signals. An intermediate frequency (IF) of 4–6 GHz is useful to provide a frequency high enough to filter the undesired image product after upconversion to the sub-THz frequency band, but low enough to achieve optimal error vector magnitude (EVM) performance - a critical metric for 6G hardware to achieve high data throughput when using higher-order modulation formats.
The E8267D provides a low-phase-noise local oscillator (LO) to the VDI upconverter, which converts the 4–6 GHz IF to the desired sub-THz frequency band using a 6x multiplication factor for the LO frequency. A VDI downconverter then downconverts the signal to a 4–6 GHz IF, which is then digitized by the UXR, a multichannel high-performance oscilloscope.
You can use different VDI converters to scale the testbed across various frequency bands, and a variety of software lets you generate and analyze candidate waveforms. The testbed supports software written for test applications as well as PathWave System Design, PathWave Vector Signal Analysis (VSA), and IQtools. You can also scale the number of channels to perform multiple-input multiple-output (MIMO) research because the testbed uses multichannel hardware.
Using this setup, you can make conducted wide-bandwidth measurements at sub-THz frequencies. For example, Keysight performed single-carrier quadrature amplitude modulation (QAM) measurements at the D band in the 140-148 GHz frequencies (centered at 144 GHz) with varying modulation bandwidths. These conducted measurements were made without horn antennas using a VDI D-band amplifier, a VDI 140-148 GHz bandpass filter, and a variable attenuator between the VDI upconverter and the VDI downconverter, along with waveguide test ports.
Since 6G waveforms are not defined, Keysight used preliminary 802.11ay test software for the signal generation and analysis. Figure 2 shows the measurements for an 802.11ay two-channel bonded (CB2) signal centered at 144 GHz with a channel bandwidth of 4.32 GHz.

Figure 2. 16 QAM MCS12 measurements at 144 GHz with D-band (left) and G-band (right) VDI converters, CB2 configuration with 4.32 GHz channel bandwidth
The same test setup can perform measurements for an 802.11ay four-channel bonded (CB4) signal centered at 144 GHz with a channel bandwidth of 8.64 GHz. The CB4 test case used a higher-frequency 5 GHz IF to make filtering of the undesired image easier. The measurement results appear in Figure 3.

Figure 3. 16 QAM MCS12 measurements at 144 GHz with D-band (left) and G-band (right) VDI converters, CB4 configuration with 8.64 GHz channel bandwidth
The EVM degrades between Figure 2 and Figure 3 because the modulation bandwidth doubles. Greater modulation bandwidth increases the integrated noise power within the signal bandwidth. In addition, there is more linear amplitude and phase variation as the signal bandwidth increases.
Keysight used the same setup to perform measurements at 144 GHz for an extreme-bandwidth test case with an occupied bandwidth of 10 GHz (Figure 4) although the testbed used the VDI G-band (140–220 GHz) converters instead of the VDI D-band ones used in the previous examples. The IF increased to 6 GHz, once again to make filtering of the undesired image easier given the wider modulation bandwidth.
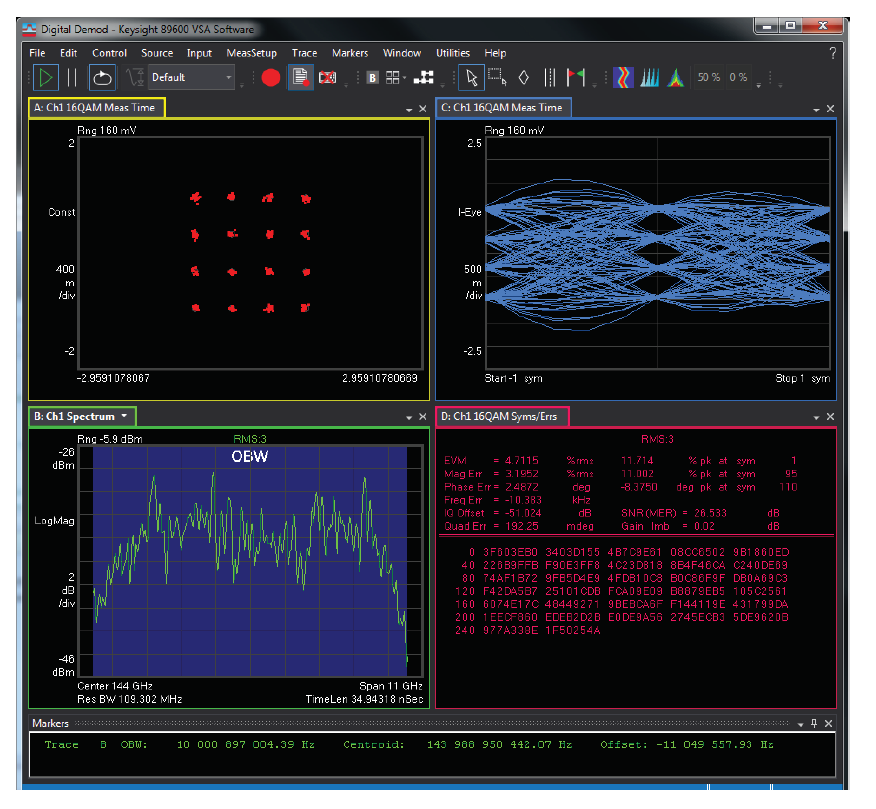
Figure 4. 16 QAM measurements at 144 GHz with G-band VDI converters, 10 GHz occupied bandwidth
The baseband waveform was pre-corrected with a complex response before downloading the waveform to the M8195A AWG. The VSA adaptive equalizer was disabled for these measurements after pre-correcting the waveform, and the measured EVM was 4.7%. The EVM normalization reference was set to reference RMS for these EVM measurements. The modulation order then increased to 128 QAM, as shown in Figure 5.

Figure 5. 128 QAM measurements at 144 GHz with G-band VDI converters, 10 GHz occupied bandwidth
You will need a flexible and scalable testbed to gain insight into the performance of your 6G designs. The next generation of cellular technology requires test solutions that can scale across frequency bands and provide high flexibility for waveform generation and analysis while enabling MIMO research.
For more information on the measurements discussed in this blog and other examples, download the application note A New Sub-Terahertz Testbed for 6G Research or visit Keysight’s 6G Technology web page for a demonstration video.